Research Article - (2024) Volume 12, Issue 2
Understanding rainfall distribution is crucial for sustainable water resource management and several economic activities. This study investigated seasonal and annual spatiotemporal variability and trends of rainfall in East Africa and their impacts on Lake Victoria water levels to update information that supports planning, management, and improvement of water dependent socioeconomic activities. Surface water observations for both the satellite (DAHITI altimetry) and ground based stations for 30 years were used in the study. The datasets were analyzed considering of the annual, and seasonal rainfall variability, trends of precipitation, variations of water levels, and the influence of rainfall on water level fluctuations of Lake Victoria the shared lake of East Africa. Study results showed an increase in water levels in Lake Victoria for the past 30 years. The rainfall trend showed a non-significant increase, as tested by Mann Kendall and the linear fit (Sen’s) test. Moreover, there was a noticeable variation in seasonal rainfall, with rainfall varying much more in the dry seasons of June to August (JJA) and December to February (DJF), than in rainy seasons, March to May (MAM) and October to December (OND). Significant correlations were observed between rainfall from Bunjumbura and Gisozi ground based rainfall stations and Lake Victoria water levels, although a weak relationship exists with other ground based stations around the Lake Victoria basin. The study concludes that rainfall influences the lake water levels to a lesser extent; hence, it is recommended to consider the analysis of other different water resources in the Lake Victoria catchment, especially Inlet Rivers and groundwater. The information obtained from this study could be used as input for decision makers to take appropriate adaptive measures in water resource management.
Rainfall variability • Water levels • Lake Victoria • East Africa
Water resources are already demonstrated to have been affected by natural and anthropogenic factors, resulting in an increased frequency and severity of extreme weather events globally. If global environmental challenges are to be addressed effectively, a coordinated international approach is required [1-3].
East Africa experiences varying rainfall, with some areas receiving heavy rains that in some instances have resulted in property destruction and death of both livestock and human beings, while other areas have experienced drought and subsequently severe famine. This pattern of variance has prompted studies aimed at detecting whether rainfall patterns have been changing and their impacts on lake water levels [4]. An understanding of the temporal and spatial characteristics of rainfall is very crucial to water resource planning and management [5,6].
Other studies indicated that hydrological processes are characterized by high variability of rainfall both in space and time, making them sensitive to small-scale temporal and spatial rainfall variability [7]. Over the last decade, several lakes in the East African region have witnessed an increase in their water levels, areas, and volumes, thus affecting the rich neighboring biodiversity, infrastructure, and livelihoods of the local communities [6].
Rainfall is very important for the lake's ecological system, as it accounts for a large percentage of its recharge [5,6]. Elsewhere, it has been indicated that hydrological processes are characterized by high variability of rainfall both in space and time, making them sensitive to small scale temporal and spatial rainfall variability [7]. Rainfall is proved as one of the main sources of water that pours into the lake; therefore, its variation in water levels should be of paramount importance. Perhaps, rainfall variability and the associated rainfall events have over several decades caused abrupt changes in water levels, transport difficulties, socioeconomic losses (due to the loss of fish), and famine. Recently, the water level of Lake Victoria has reached unprecedented heights as a result of heavy rains in the East African region, which started in August 2019 [8].
According to Awange, et al., [5], Lake Victoria water level has been receding at an alarming rate and threatening all socio-economic activities associated with it over the last decade; however, several lakes over the East African regions have witnessed an increase in their lake water levels, areas, and volumes, thus affecting the rich neighboring biodiversity, infrastructure, and livelihoods of the local communities [6].
In recent years, the occurrence of extreme events, such as drastic water level changes, have caused the public to outcry for attention. The diverse threat of high water levels from Lake Victoria caused the shutdown of several socio-economic activities such as the fishing industry, small-scale market centers, recreation centers, agriculture, disease outbreaks, displacement of downstream communities, etc. The surrounding areas of the Lake Victoria basin and the Kampala metropolitan area in Uganda were submerged by floodwater, affecting the transport and movement of people and goods. This affected the livelihood of many people living around the Victoria basin, as it was reported that over 200,000 people were displaced because of the floods [8].
Variations in the rainfall amounts within the Lake Victoria basin have raised several concerns, and several scientists have suggested the need for constantly carrying out temporal analysis of precipitation using updated datasets to analyze the current trends in precipitation over the basin [9]. Thus, this study aims to investigate seasonal and annual spatial-temporal variability trends of rainfall in East Africa and its impacts on Lake Victoria water levels to update information to support planning, management, and improvement of water dependent socio-economic activities.
Study area
The study focused on the Lake Victoria basin, which comprises five countries located in the eastern part of the African continent. The region is enclosed within the geographical latitudes 5.1°N to 11.74°S and longitudes 28.9°E to 41.91°E. Lake Victoria is a shallow water lake formed as a result of a geographical system known as warping. It is considered one of the most important shared natural resources of the East African community countries [10]. The lake is shared by Kenya with 6%, Uganda with 43%, and Tanzania with 51% of the total area of 69,000 km2. Rainfall is a very critical factor in the lake's ecological system, as precipitation accounts for 80 percent of the recharge of Lake Victoria [5,6]. There are also rivers such as Kagera, which originates from Burundi and Rwanda, and other streams that recharge Lake Victoria, which all account for about 20% [5].
Generally, East Africa (EA) experiences two main rainy seasons; that is March to May (MAM), usually referred to as the ‘long rains’ and October to December (OND) referred to as the ‘short rains’ Gamoyo et al. 2015 [9]. The rains are also influenced by atmospheric phenomena such as the El-Nino Southern Oscillation (ENSO) and the Indian Ocean Dipole (IOD) [11]. The El Nino Southern Oscillation (ENSO) phenomena are strongly associated with the inter-annual variability of rainfall in this region.
In the present study, to investigate the spatiotemporal variability of rainfall, 13 rainfall stations in the East Africa region, namely Entebbe, Kampala, Jinja, Kampala, Bukoba, Musoma, Mwanza, Kisumu, Gitega, Bujumbura, and Gisozi were considered. The location of selected stations is shown in Figure 1. Daily data for precipitation and water levels were obtained from the Uganda National Meteorological Authority and the Directorate of Water Resources Management, respectively, covering the Lake Victoria catchment. The data period varied across several regional meteorological stations; therefore, only 30 years (1990-2020) of data have been selected as a common period between all stations and finally converted into monthly data. To analyze the monthly descriptive statistics of precipitation, statistical characteristics like mean and median were used. The coefficient of variation was utilized to determine the dispersion.
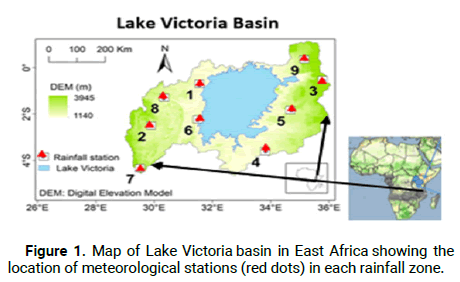
Figure 1: Map of Lake Victoria basin in East Africa showing the location of meteorological stations (red dots) in each rainfall zone.
Climate of the area
Geographically, Lake Victoria spans latitudes 0.33°N–3°S and longitudes 31.67°E–34.88°E and is the third largest lake in the world after lake superior the second and Caspian Sea the largest of the great lakes. It experiences annual rainfall of about 1200 mm throughout the year, generally distributed into two distinct rainfall seasons [12]. The Lake Victoria basin has a bimodal rainfall structure, with one long rain season which approximately stretches from March to May (MAM) that coincides with the intertropical convergence zone, which follows the overhead sun around March 21st [13]. This is followed by a long dry season stretching from June to August (JJA). A shorter rain season is experienced during the period of September to November (SON), followed by a short dry season in the following months of December to February (DJF).
Like most parts of east Africa, the lake basin climate is affected by synoptic system such as intertropical convergence zone, subtropical anticyclones, tropical cyclones, monsoons, global sea surface temperatures, El-Nino and Southern oscillation.
Data collection and sources
For the purposes of determining the long term spatial average (1981-2020) annual and seasonal rainfall variability over the lake Victoria basin, Climate Hazards Group Infrared Precipitation with Station datasets version 2 (CHIRPS2.0) based on thermal Infrared (IR) from geostationary satellites were used. It has a spatial resolution of 0.05 degrees (5 km) and a daily temporal resolution. CHIRPS2.0 begins in 1981 and extends to the present time (2023, in this study). It is based on cold cloud duration from two geosynchronous thermal IR archives produced by NOAA. The thermal IR data are merged with African gauge data, using ‘smart’ interpolation techniques that take the spatial correlation structure into account. The CHIRPS2.0 data have low bias and better gauge coverage over Africa compared to other similar products.
For in situ data Meteorological stations within the Lake Victoria basin (the study area), which include Entebbe meteorological station under the Uganda National Meteorological Authority, Kisumu weather station in Kenya, and Musoma, Bukoba and Mwanza meteorological stations in Tanzania, Gitega, Bujumbura in Burundi, and Gisozi in Rwanda were considered. Lake Victoria water level data were obtained from the DAHITI satellite altimetry database: https://dahiti.dgfi.tum.de/en/products/water-level-altimetry/. The in situ (ground observation station) rainfall and DAHITI lake level data were used to investigate the trends and relationship between the two variables.
Data analysis and tools
Python: Python which is a computer programming language and software, to automate tasks, and conduct data analysis was used for statistical computing and graphical analysis. Time series plots, trend and correlation analysis were performed using the normalized rainfall and water level records. Graphical methods were applied to examine the seasonal and annual time series and trends of the two variables for 30 years. The seasons considered were March to May (MAM), June to August (JJA), September to November (SON) and December to February (DJF).
The correlation between the variables was investigated using Pearson correlation coefficient (r). Pearson correlation coefficient (r) is the most common and powerful way of measuring a linear correlation considering normal distribution of the variables. It is a number between –1 and 1 that measures the strength and direction of the relationship between two variables [14]. The Pearson correlation coefficient also states whether the slope of the line of best fit is negative or positive. When the slope is negative, r is negative. When the slope is positive, r is positive. When r is 1 or –1, all the points fall exactly on the line of best fit: When r is greater than 0.5 (strong positive correlation) or less than –0.5 (strong negative correlation), the points are close to the line of best fit: When r is between 0 and 0.3 or between 0 and –.3, the points are far from the line of best fit: (weak positive correlation) or less than –0.5 (weak negative correlation) respectively. When r is 0, a line of best fit is not helpful in describing the relationship between the variables: (no correlation). Calculating the Pearson correlation coefficient (r) is as shown in equation 1:
r=(nΣxy-(Σx)( Σy))/√(nΣx²-(Σx)² nΣy²-(Σy)² (1)
Where;
X=Independent variable (rainfall)
Y=Dependent variable (lake level)
n=Sample size
Σ=Represents a summation of all values
Grid Analysis and Display System (GrADS)
Spatial analysis that was critical in investigating spatial variability of rainfall was performed using Grid Analysis and Display System (GrADS).
The Grid Analysis and Display System (GrADS) is an interactive desktop tool that is used for easy access, manipulation, and visualization of earth science data. The format of the data may be either binary, GRIB, NetCDF, or HDF-SDS (Scientific Data Sets). GrADS uses a 4-dimensional data environment: Longitude, latitude, vertical level, and time. Data sets are placed within the 4D space by use of a data descriptor file. GrADS interprets station data as well as gridded data, and the grids may be regular, non-linearly spaced, Gaussian, or of variable resolution. In this study NetCDF data format was used.
OriginPro was used for temporal (Annual and seasonal) analysis of rainfall variability in Lake Victoria water basin and was objectively assessed for graphics generation.
Spatial variability of rainfall
The spatial distribution of mean (30 years average) annual and seasonal precipitation (rainfall) across the study area was examined during the observation period (1991-2020), as depicted in Figures 2 and 3. The spatial distribution of mean annual, MAM and JJA rainfall (Climatological) over Lake Victoria basin in East Africa. During SON season, the rainfall distribution shows that climatological mean rainfall decreases to the south, while during DJF season, the rains are concentrated in the south in agreement with the position of ITCZ. In this study, a large portion of the area (about 70%) of Lake Victoria basin experiences a mean annual rainfall of 900 mm to 1500 mm, followed by a category of 1500 mm to 2300 mm (about 20% areal coverage), and about 1% of the area receives the highest level of the mean annual rainfall, ranging from 2300 mm to 2500 mm. The remaining portion of the basin experiences less than 900 mm of rainfall annually on average.
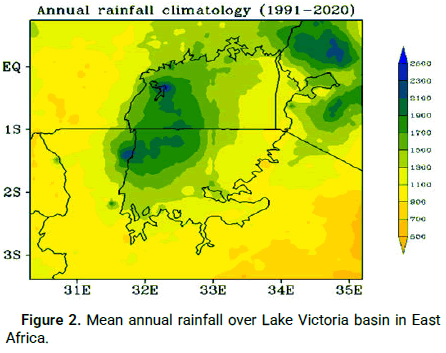
Figure 2: Mean annual rainfall over Lake Victoria basin in East Africa.
Different colors in Figures 2 and 3 indicate different values of rainfall, from minimum (orange) to maximum wetness (deep blue), both annual and seasonal. Climatological average rainfall during MAM season ranges between 300 mm and 800 mm; JJA average rainfall ranges between 20 mm and 350 mm; and OND average rainfall ranges between 300 mm and 550 mm. The rainfall characteristics investigated in this section partially describe the seasonal performance and scale factor values determining variations in water levels in Lake Victoria.
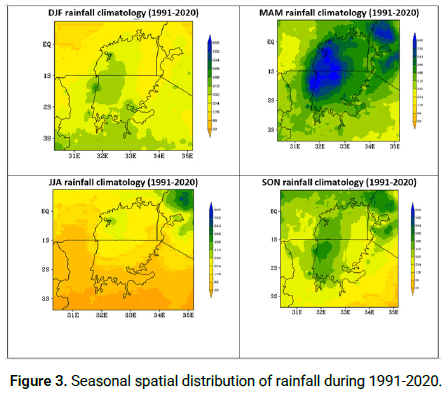
Figure 3: Seasonal spatial distribution of rainfall during 1991-2020.
Time series and trend of rainfall
The time series of annual rainfall from Kamenyamigo, Kawanda, Jinja, Kituza, and Entebbe ground based stations (Figure 4).
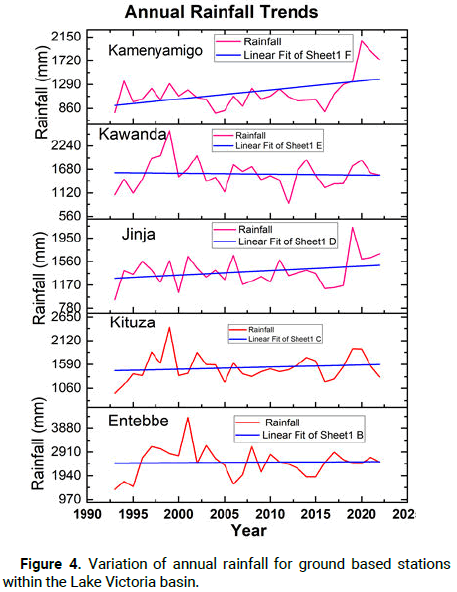
Figure 4: Variation of annual rainfall for ground based stations within the Lake Victoria basin.
The results show that the highest amount of rainfall of 4365 mm was recorded around 2001 at Entebbe station, and the least amount of about 900.0 mm was registered in 1993 at Jinja. However, almost all stations showed greater temporal variability in rainfall between 1993 and 2010, and an increasing annual rainfall trend between 1991 and 2020, although statistically insignificant when applied through the Mann-Kendal trend test [15].
Analysis of water level fluctuations
Figures 5-8 show the temporal variation of the average seasonal Lake Victoria water level taken from Entebbe station in Uganda. Results revealed that Lake Victoria's water level fluctuated between 10.2 m and 13.4 m with constant increase during the JJA and OND seasons from 2005 to 2022.
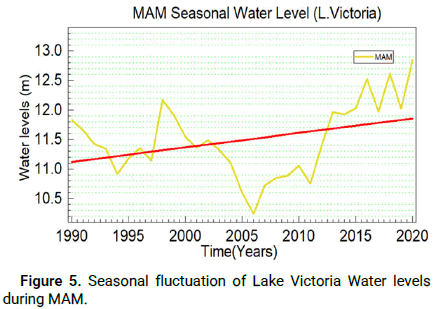
Figure 5: Seasonal fluctuation of Lake Victoria Water levels during MAM.
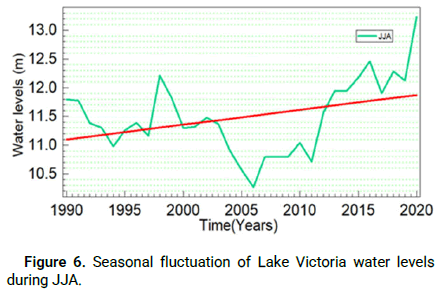
Figure 6: Seasonal fluctuation of Lake Victoria water levels during JJA.
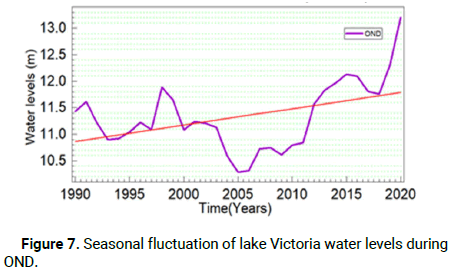
Figure 7: Seasonal fluctuation of lake Victoria water levels during OND.
The trends of Lake Victoria water levels are significantly positive, as indicated by the Mann-Kendall test (Table 1). This implies that water levels have been gradually increasing with time for the last 30 years, as indicated in Figures 5-7, the increment of water levels generate more negative impact than positive on the social-economic activities of communities leaving in with in the lake basin which includes displacement, death of population and lose of biodiversity. In this study it was necessary to compare data sets from different sources, in situ station rainfall indicated significant positive trends for individual stations in Figure 9. There is a significant trend of increasing water levels, which agree with the known principle that an increase or decrease in rainfall should have a positive or negative significant impact on surface water levels, which implies some other factors such as discharges at Owen Falls and Nalubale Dams and inflows from rivers such as Kagera within the lake victoria catchment areas could also influence the fluctuations in lake levels. For that reason, the satellite altimetry dataset from DAHIT data sets was also used for the analysis of Lake Victoria water levels and was compared with the observed datasets. The results indicate that both the observed and satellite-based lake level datasets showed a similar pattern, as shown in Figures 8 and 9.
Normalized water level variation (1991-2022)
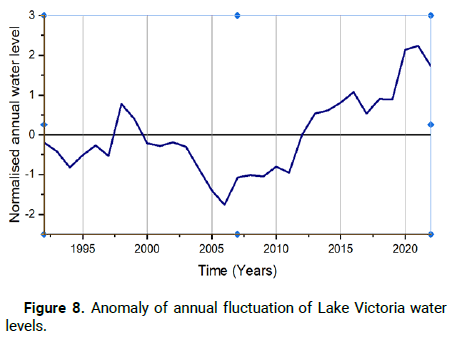
Figure 8: Anomaly of annual fluctuation of Lake Victoria water levels.
The normalized annual water level time series analysis in Figure 8 shows below average lake water levels for 9 years from 1991 to 1997 followed by a peak of above average in 1998. Water level declined for 13 years as fluctuations was in negative range from 2000 to 2012. It was observed that water level increased to above average for 10 years from 2012 to 2022. This study realized that total number of years below average is 21 and 10 years of above average.
Outputs from the Altimetry dataset analysis from 1991-2023 Figure 9, results indicate that lake Victoria experienced great fluctuations for the period 1991-2023. The maximum height of 1120.18 meters above Mean Sea Level (MSL) was observed in 2020, followed by 1998, and the minimum height of 1117.62 meters occurred on October 28, 2006. This result shows that lake Victoria water level dropped by about 2.5 meters during this period. The average height during this period was 1118.74 meters above mean sea level. The fluctuations of the lake height can be divided into four periods, as follows:
• The relatively stable period from 1991 to 1997.
• The significant increase period from 1998 to 1999.
• The sharp drop period from 2000 to 2006.
• The gradual increase period from 2007 to 2016.
• The gradual increase period from 2016 to 2018.
• The gradual increase period from 2018 to 2020.
During the significant increase period from 1998 to 1999, the lake height rose by about 1.7 meters; however, the lake height dropped about 2.5 meters during the sharp drop period from 2000 to 2006. These results are consistent according to GRLM, which uses a combination of T/P, Jason-1, and Jason-2 radar altimetry data.
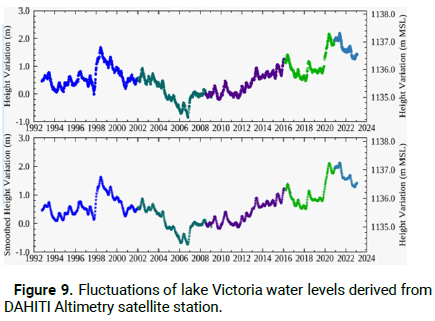
Figure 9: Fluctuations of lake Victoria water levels derived from DAHITI Altimetry satellite station.
HYDROWEB, G-REALM altimetry databases, and in situ water level gauge stations for Lake Victoria from 1992 to 2023. This study considered DAHITI as a source of satellite altimetry datasets for lake level due to its continuity and consistency with in situ data compared to other external altimeter data bases such as G-REALM and HYDROWEB, according to Schwatke, et al. (Table 1) [16].
| Kendall's tau | 0.251 |
| S | 109 |
| Var (S) | 3141.667 |
| p-value (Two-tailed) | 0.054 |
| Alpha | 0.05 |
| Sen’s slope | 0.032 |
Table 1. Mann Kendall test results.
H0=There is no trend in the series.
Ha=There is a trend in the series.
Therefore, since the computed p-value is greater than the 0.05 level of significance, the null hypothesis cannot be rejected. Thus, there is no significant trend in the series of water levels. However, the positive Sen’s slope value (0.032) implies water levels present a positive trend besides being non-significant.
The Table 2 below shows that over the past 30 years, the maximum recorded water level recorded is approximately 13.02 m, while the minimum is 10.24 m, a range of 2.78 m observed for the period under study. The average water level is calculated to be approximately 11.4 m with a standard deviation of 0.62 m, meaning that the average water level can be less or greater by 0.62 m.
| Minimum | Maximum | Range | Mean | Standard deviation |
|---|---|---|---|---|
| 10.24 | 13.02 | 2.78 | 11.4 | 0.61 |
Table 2. Summary of water level analysis results.
From the analysis in the Table 3 below, no correlation coefficient equals zero, which means the two variables, water level, and rainfall are correlated. It further shows that most of the correlation coefficient values are less than 0.3 apart from August which has got 0.37 implying that the relationship ranges from weak to moderate.
| Jan | Feb | Mar | Apr | May | Jun |
|---|---|---|---|---|---|
| -0.0729 | 0.279434 | 0.125554 | 0.091908 | 0.202014 | 0.029121 |
| Jul | Aug | Sep | Oct | Nov | Dec |
| 0.06 | -0.37 | 0.08 | -0.28 | 0.08 | 0.16 |
Table 3. Correlation analysis results.
Interpretation criteria of correlation coefficient (R)
+/- R > 0.6=Strong relationship +/- 0.3>R<0.6=Moderate relationship +/- R<0.3=Weak relationships R=0=No relationship
January, August, and October have negative correlation coefficients, while the rest of the months have positive correlation coefficients. A negative correlation describes the extent to which two variables move in opposite directions, while a positive correlation exists when two variables move in the same direction. Therefore, for the months of January, August, and October, the variables were in inverse correlation, and vice versa for the rest of the months. The highest absolute correlation between water level and rainfall occurred in August, and it’s a negative correlation whereas the lowest absolute correlation of 0.029121 occurred in June.
Applying the seasonal analysis, MAM presents the highest correlation value (positive) although is less than 0.3, implying that it is a weak relationship. DJF also shows a weak positive relationship. The JJA and SON seasons presents the least correlation coefficients and negative, meaning the relationship between variables is much weaker and inverse. The annual correlation coefficient is 0.07, which generally shows a weak relationship between the two variables (Table 4).
| MAM | JJA | SON | DJF |
|---|---|---|---|
| 0.19 | -0.11 | -0.08 | 0.13 |
Table 4. Seasonal analysis for MAM presenting correlation between rainfall and lake levels.
It is noticed that the correlation coefficients (r) along the diagonal of the table are all equal to 1 because each variable is perfectly correlated with itself. These cells aren’t useful for interpretation. The purpose of this study was to calculate and find out the relationship between rainfall and water level. The results indicate that there is a weak positive correlation between Lake Victoria water levels and rainfall analyzed from 12 stations within the lake catchment since r is between -0.1 and 0.4. But 2 stations indicate a correlation of 0.6 implying that there is a strong positive correlation because r is greater than 0.5 (Tables 5 and 6).
| Station | Observations | Obs. with missing data | Obs. without missing data | Min | Max | Mean | Std. deviation |
|---|---|---|---|---|---|---|---|
| Kisumu | 31 | 0 | 31 | 1034.9 | 1808.3 | 1400.2 | 180.6 |
| Entebbe | 31 | 0 | 31 | -8510.8 | 1654.3 | 970.7 | 1765.3 |
| Jinja | 31 | 0 | 31 | -8625.8 | 1791.5 | 1049.5 | 1803 |
| Kampala | 31 | 0 | 31 | 1046.9 | 1728.6 | 1291.1 | 144.9 |
| Mukono | 31 | 0 | 31 | -8408.1 | 1738.2 | 1030.7 | 1758 |
| Bukoba | 31 | 0 | 31 | 1482.9 | 2302.8 | 1825 | 233.8 |
| Musoma | 31 | 0 | 31 | 680.9 | 1393.1 | 944.7 | 165.7 |
| Mwanza | 31 | 0 | 31 | 711.7 | 1649.1 | 1167.8 | 248 |
| Kisumu | 31 | 0 | 31 | 1034.9 | 1808.3 | 1400.2 | 180.6 |
| Gitega | 31 | 0 | 31 | 972.2 | 2022 | 1436.3 | 241.2 |
| Bujumbura | 31 | 0 | 31 | 760.5 | 1523.5 | 1126 | 179.4 |
| Gisozi | 31 | 0 | 31 | 1247.2 | 2481.6 | 1730.6 | 294.5 |
| Water levels | 31 | 0 | 31 | 10.2 | 13 | 11.4 | 0.6 |
Table 5. Summary statistics of 1 catchment rainfall and water levels.
| Correlation matrix (Pearson): r | |||||||||||||
|---|---|---|---|---|---|---|---|---|---|---|---|---|---|
| Variables | Kisumu | Entebbe | Jinja | Kampala | Mukono | Bukoba | Musoma | Mwanza | Kisumu | Gitega | Bujumbura | Gisozi | Water levels |
| Kisumu | 1 | 0.018 | 0.038 | 0.530 | 0.020 | 0.559 | 0.752 | 0.438 | 1.000 | 0.563 | 0.602 | 0.611 | 0.138 |
| Entebbe | 0.018 | 1 | 0.998 | -0.165 | 1.000 | 0.166 | 0.128 | 0.126 | 0.018 | 0.085 | 0.116 | 0.072 | 0.040 |
| Jinja | 0.038 | 0.998 | 1 | -0.181 | 0.998 | 0.172 | 0.148 | 0.135 | 0.038 | 0.114 | 0.151 | 0.117 | 0.083 |
| Kampala | 0.530 | -0.165 | -0.181 | 1 | -0.161 | 0.501 | 0.424 | 0.255 | 0.530 | 0.286 | 0.225 | 0.179 | -0.102 |
| Mukono | 0.020 | 1.000 | 0.998 | -0.161 | 1 | 0.168 | 0.131 | 0.133 | 0.020 | 0.088 | 0.116 | 0.073 | 0.037 |
| Bukoba | 0.559 | 0.166 | 0.172 | 0.501 | 0.168 | 1 | 0.586 | 0.057 | 0.559 | 0.111 | 0.156 | 0.158 | -0.131 |
| Musoma | 0.752 | 0.128 | 0.148 | 0.424 | 0.131 | 0.586 | 1 | 0.581 | 0.752 | 0.543 | 0.564 | 0.567 | 0.023 |
| Mwanza | 0.438 | 0.126 | 0.135 | 0.255 | 0.133 | 0.057 | 0.581 | 1 | 0.438 | 0.606 | 0.571 | 0.515 | 0.066 |
| Kisumu | 1.000 | 0.018 | 0.038 | 0.530 | 0.020 | 0.559 | 0.752 | 0.438 | 1 | 0.563 | 0.602 | 0.611 | 0.138 |
| Gitega | 0.563 | 0.085 | 0.114 | 0.286 | 0.088 | 0.111 | 0.543 | 0.606 | 0.563 | 1 | 0.927 | 0.915 | 0.445 |
| Bujumbura | 0.602 | 0.116 | 0.151 | 0.225 | 0.116 | 0.156 | 0.564 | 0.571 | 0.602 | 0.927 | 1 | 0.954 | 0.599 |
| Gisozi | 0.611 | 0.072 | 0.117 | 0.179 | 0.073 | 0.158 | 0.567 | 0.515 | 0.611 | 0.915 | 0.954 | 1 | 0.595 |
| Water level | 0.1 | 0.0 | 0.1 | -0.1 | 0.0 | -0.1 | 0.0 | 0.1 | 0.1 | 0.4 | 0.6 | 0.6 | 1 |
Table 6. Summary of correlation matrix from Pearson model.
The results of the study and analysis of spatial-temporal changes in precipitation and Lake Victoria water levels using the Pearson method illustrate that there was a direct and very small connection between the two parameters. Pearson linear correlation coefficient demonstrated that at the level of 95% confidence, there is no significant relationship between water levels and precipitation in Lake Victoria (Figures 10 and 11).
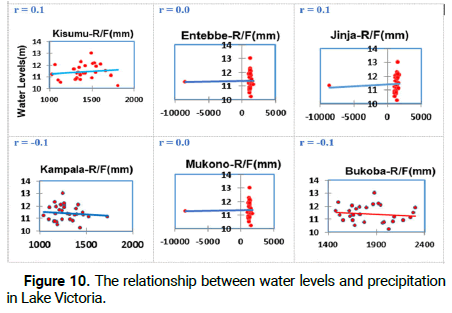
Figure 10: The relationship between water levels and precipitation in Lake Victoria.
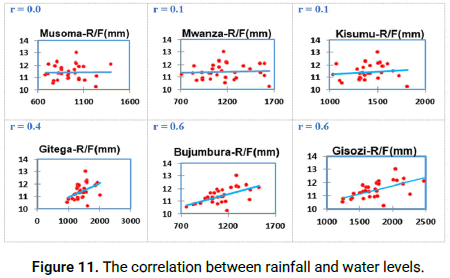
Figure 11: The correlation between rainfall and water levels.
Two rainfall stations (Bujumbura and Gisozi) were observed with high correlation where r=0.6 which is greater than 0.5 implying a “strong positive correlation” as indicated in Table 6. The results above are generated with application of correlation matrix (Pearson) running from ‘Origin Pro'.
Rainfall and water levels are important climatic parameters affecting socio-economic activities and livelihoods. Geospatial analysis plays an important role in mapping, examining spatial and temporal changes, as well as aiding water resource planning. In this study, spatial analysis was done using the GrADS software package to assess rainfall variability in the study area in the Lake Victoria basin. Statistical analysis reveals a weak to moderately strong relationship between lake levels and rainfall causing water levels to increase to the highest peak of 13.4 m. Water rise at this height means loss of property and life which requires much attention considering more research on the projections and forecasting of water levels for future life protection and water management for economic development along lake Victoria and East African countries.
It is necessary to conduct further studies on the water levels of Lake Victoria and major inlet rivers to identify trends and the cyclicality of their variability and assess their relationship with other factors such as changes in land use/land cover, soil infiltration, evapotranspiration, river flow, and discharge. Special attention should be paid to further calibrating and validating satellite data from G-REALM and HYDROWEB satellite altimetry because they differ significantly from each other and in situ records at the local water level gauge stations. The relationship between altimetry and in situ data could help in the re-calculation of water level datasets specific for Lake Victoria, river Kagera, and other basin inlet major rivers.
All these efforts will make it possible to improve forecasting services for management and the safe functioning of the lake for sustainable development.
The authors would like to thank anonymous reviewers who helped to improve the quality of this paper, the providers of data for analysis, including the Uganda National Meteorological Authority, the Directorate of Applied Data and Climate Services (DADCS), the Directorate of Water Resources Management, the Ministry of Water and Environment, the Management of the n DAHITI satellite data facility, and data analysis software developers.
All authors have disclosed no conflicts of interest. The project was funded by the first author.
[Crossref] [Google Scholar] [PubMed]
Citation: Tumusiime MD, et al. "Influence of Spatiotemporal Variability of Rainfall on Lake Victoria Water Levels". J Climatol Weather Forecast, 2024, 12(2), 1-8.
Received: 04-Feb-2024, Manuscript No. JCWF-24-30590; Editor assigned: 07-Feb-2024, Pre QC No. JCWF-24-30590 (PQ); Reviewed: 21-Feb-2024, QC No. JCWF-24-30590; Revised: 06-Sep-2024, Manuscript No. JCWF-24-30590 (R); Published: 13-Sep-2024, DOI: 10.35248/2332-2594.24.12(2).001-008
Copyright: © 2024 Tumusiime MD, et al. This is an open-access article distributed under the terms of the Creative Commons Attribution License, which permits unrestricted use, distribution, and reproduction in any medium, provided the original author and source are credited.